FilingIntel
Read Between the Filings
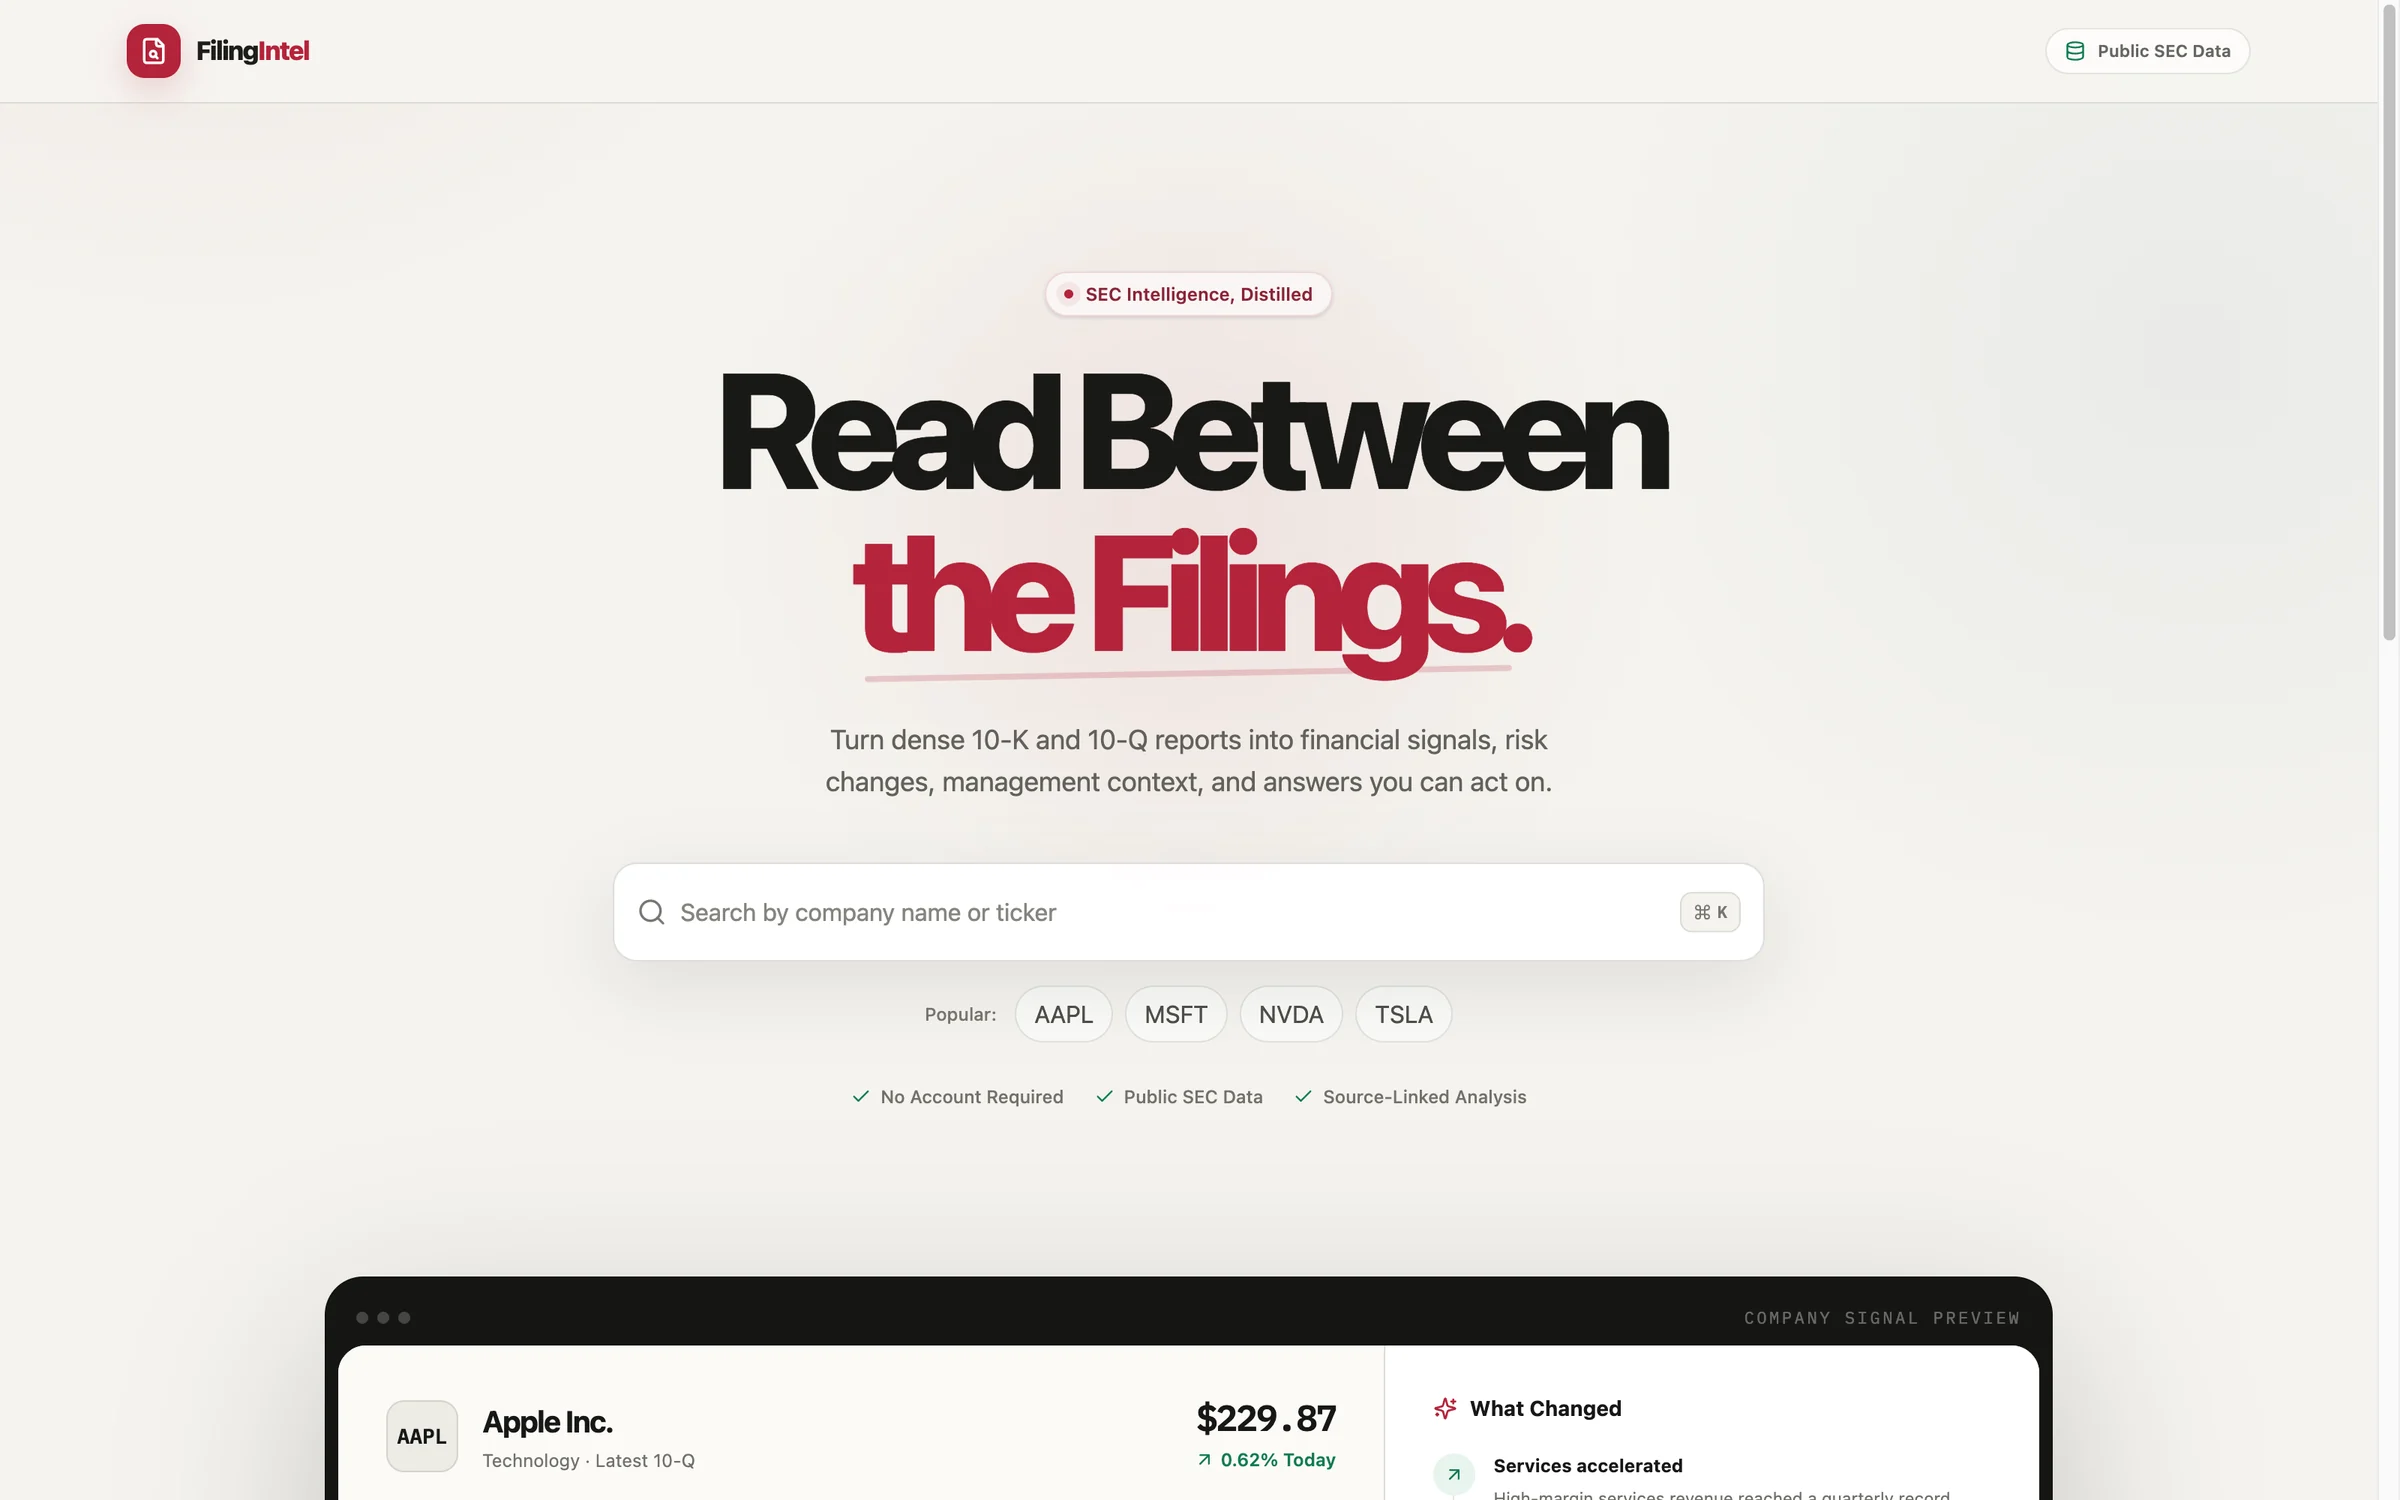
FilingIntel turns dense 10-K and 10-Q reports into financial signals, risk changes, management context, and grounded answers. Search any public US company and get a normalized, source-linked analysis built from official SEC data — not a language model's recollection of it.
The Problem
A single 10-K can run past 200 pages of financial and legal prose. The numbers an investor actually wants — how revenue moved, which risks the company rewrote this year, what management said about margins — are in there, but extracting them is an afternoon of work per company.
The tempting shortcut is to hand the filing to a language model and ask. That fails in a specific way: the model produces a confident number, and you have no way to tell a real one from a plausible one.
The Solution
FilingIntel treats that distinction as the whole product. Financial figures are computed from SEC's structured XBRL data on the server, validated, and labelled with the period they came from. The language model is used only where language is the right tool — summarizing management commentary, comparing risk disclosures, answering follow-up questions — and never to invent a figure.
Key Features
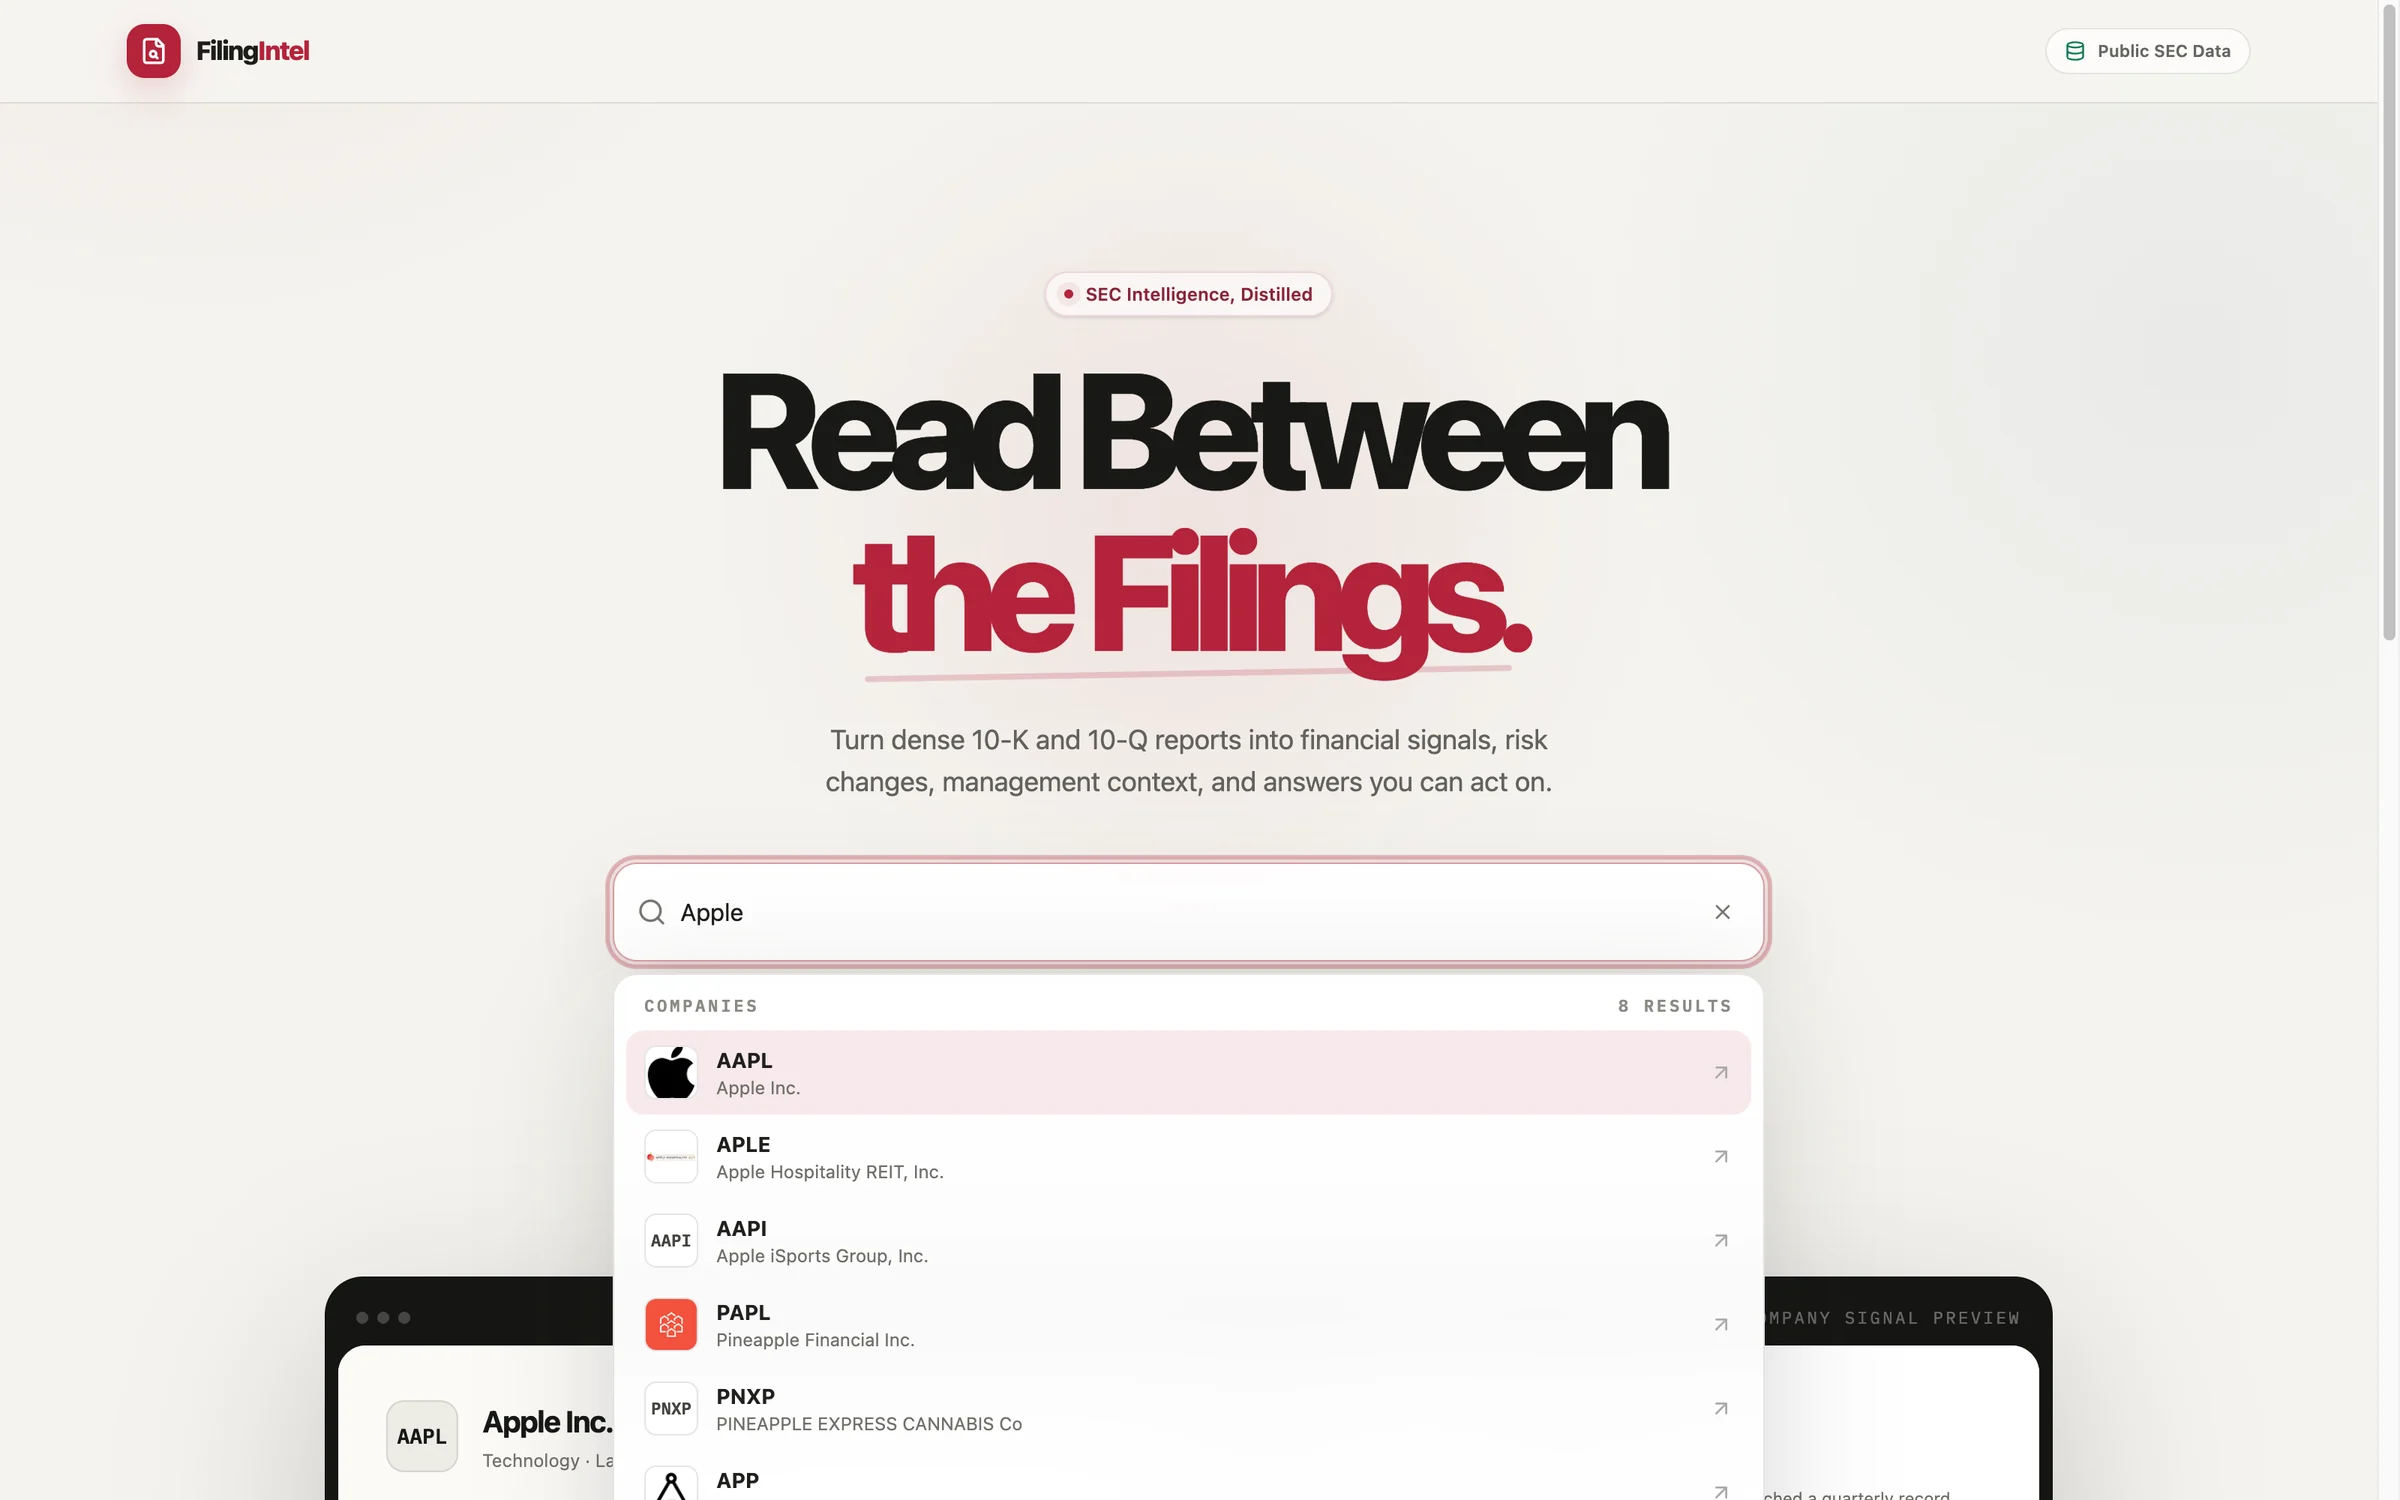
Instant Company Search — Fuse.js indexes the full SEC ticker list client-side, so ranked fuzzy matches appear as you type with no per-keystroke API call. Typing "Apple" surfaces Apple Inc. above Apple Hospitality REIT and Pineapple Financial.
Seven Analysis Views — One dashboard, seven focused tabs. Every figure names the fiscal period it covers.
Overview — what changed this filing, plus company profile and trading snapshot
Risk Diffing — Risk factors are compared against the previous annual filing and classified as new, changed, removed, or unchanged, each with a plain-English note on what the wording change actually did. For Apple's latest filing that's 19 rewritten disclosures and one dropped — the kind of movement that is invisible if you read either filing on its own.
Segment Honesty — Companies publish several independent cuts of the same quarter. FilingIntel shows each breakdown separately and says so explicitly, because stacking them would count the same revenue twice.
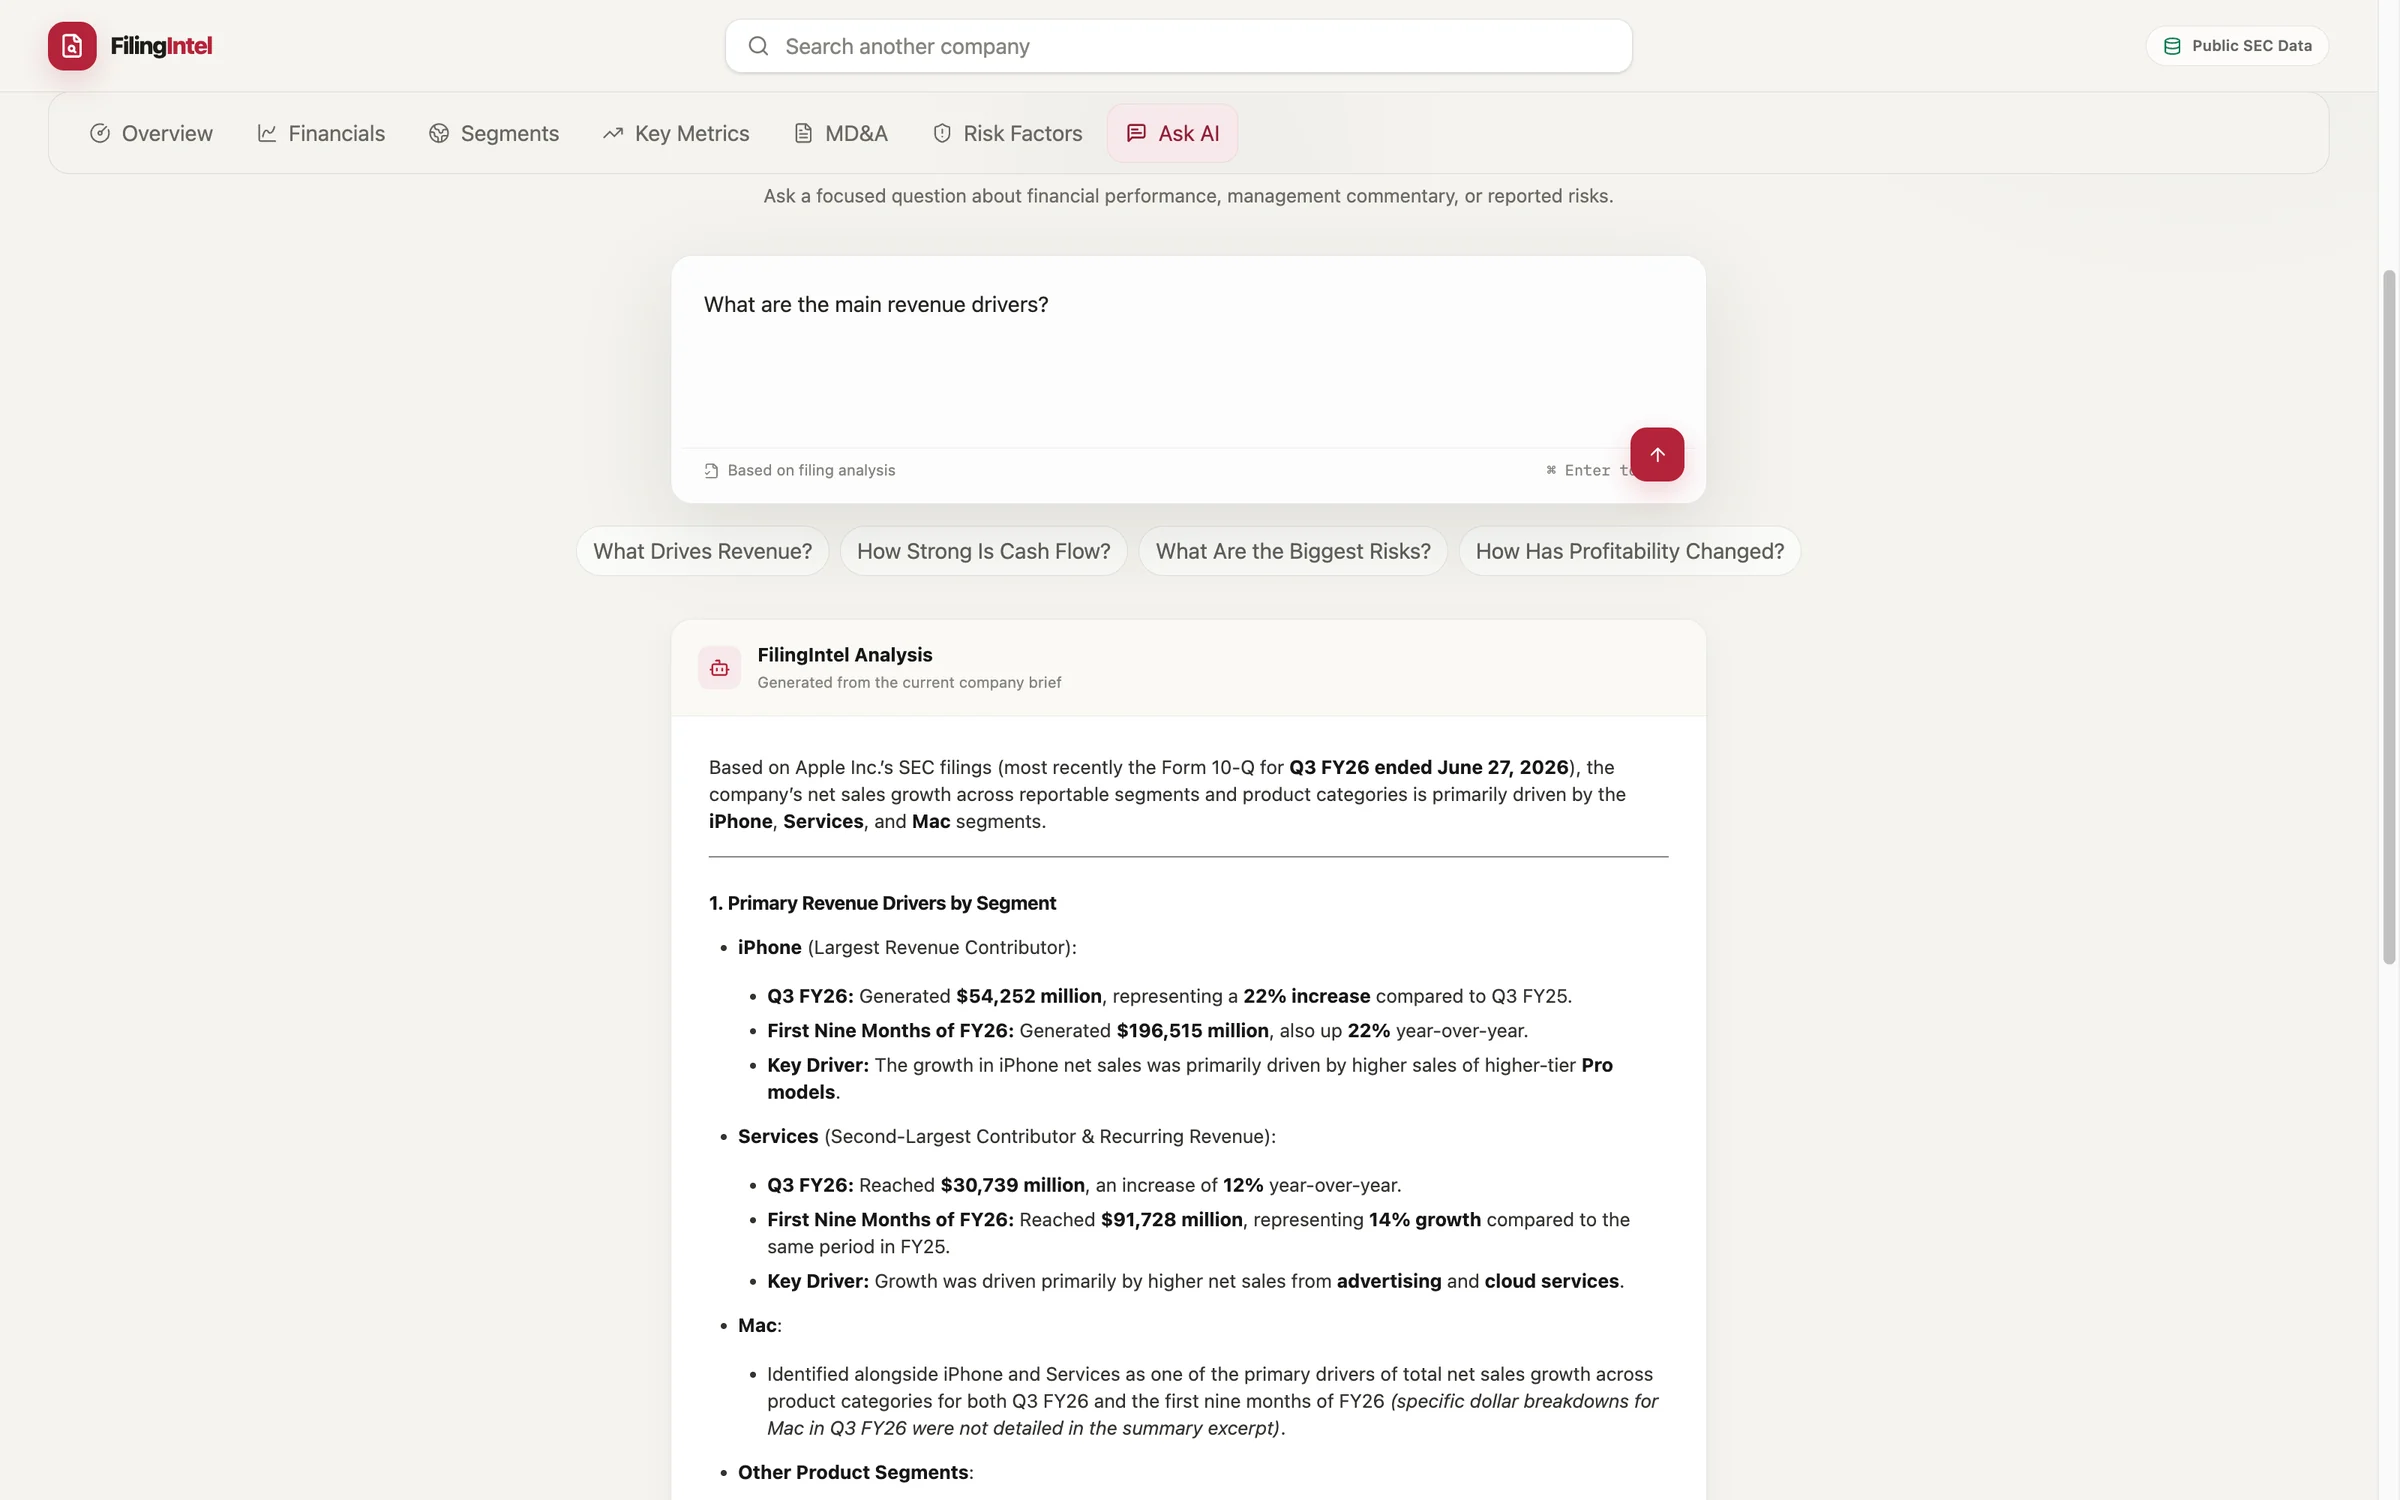
Grounded Q&A — Ask a question and the answer arrives with its filing and period named. The model works from the company brief the server already built, so answers stay consistent with the numbers shown in the other six tabs.
How It Works
- Search — Fuse.js ranks matches against the cached SEC ticker list, entirely in the browser
- Fetch — Cloud Functions pull the company's submissions and XBRL company facts from SEC EDGAR
- Normalize — Facts are resolved to concepts, aligned to the company's fiscal calendar, split into clean quarters, and run through plausibility gates before anything is stored
- Summarize — Gemini reads the filing sections for MD&A, risk movement, and management signals
- Serve — The finished company record is cached in Firestore; a page view is a single read
Technical Architecture
Frontend — React 19 and TypeScript on Vite 7, styled with Tailwind CSS 4. Charts are Recharts; Motion handles transitions and NumberFlow animates figures as they land. Skeleton components hold layout while each section resolves, so the page never jumps.
Backend — Firebase Cloud Functions on Node 22. Three proxies (SEC, Gemini, Polygon) sit in front of every third-party call. API keys live in Firebase Secret Manager and never enter the client bundle, and each proxy verifies a Firebase App Check token before forwarding.
The normalization layer — The substantial part of the rebuild. A pure-function pipeline (no network, no Firebase) turns SEC company facts into a fiscal-aligned view: concept resolution, quarterization, metric derivation, coverage analysis, and validation. Because it is pure, the whole thing runs offline against a committed fixture set of 50 tickers, and a coverage report prints one row per company on every run.
Persistence — One Firestore document per company, rebuilt only when a new filing appears, with a build lock so two concurrent visitors don't both trigger a rebuild. Cached records carry the pipeline version they were built with; bumping that version invalidates them, so a fix reaches every company instead of only the ones that happen to file again.
AI — Gemini 3.5 Flash Lite generates the filing summaries; Gemini 3.7 Flash handles interactive Q&A, with Google Search grounding where cross-referencing helps.
Design Decisions
- Server-side normalization — The original build parsed XBRL in the browser. Moving it to Cloud Functions made the logic testable against fixtures and let every visitor share one cached, validated result.
- Numbers from XBRL, language from the model — A model that is never asked for a figure cannot invent one.
- Fail visibly, not quietly — When a concept cannot be resolved, the metric returns null and the UI says so. Reporting an untagged balance sheet as a debt-to-equity of 0.00 is worse than reporting nothing.
- Progressive rendering — Structured financials resolve first; AI narrative arrives after. Each section renders independently rather than blocking on the slowest call.
- No accounts — Nothing about a visitor is stored. The only cached data is public company analysis, keyed by filing.
Challenges Overcome
The rebuild existed because the first pipeline was confidently wrong in ways that were hard to spot. Each fix below corresponds to a check that now runs against the fixture set.
- Mixed durations — A 10-Q can carry the same concept as a 3-month, year-to-date, and rolling 12-month figure at once. Grouping by start date charted Amazon's trailing-twelve-month cash flow as a single quarter. A quarter is now defined as 75–105 days, and year-to-date facts must start at the fiscal year start.
- Fiscal labelling — SEC's
fy/fpfields describe the filing a fact was read from, not the fact's own period, so the same quarter gets different values depending on which filing you pull it from. Labels are now derived fromfiscalYearEndplus the fact's period-end date, which is also immune to 52/53-week drift. - Tag drift — Filers change XBRL tags over time and disagree with each other: NVIDIA and Alphabet migrated revenue tags in different years, Caterpillar and Broadcom report
ProfitLossrather thanNetIncomeLoss, banks report revenue net of interest expense. Each concept now resolves through an ordered chain scored by how many recent periods a candidate actually covers, rather than taking the first tag that exists. - Trailing-twelve-month math — Computing TTM as annual plus current year-to-date minus prior year-to-date breaks whenever a 10-K is newer than the latest 10-Q, which is true for every May/June fiscal-year filer for months at a time. Summing four quarterized quarters cannot drift that way.
- Plausibility gates — A final validation layer catches results that are arithmetically possible but obviously wrong, so a number the pipeline cannot stand behind never reaches the UI looking exactly like one it can.
Future Roadmap
Peer comparison across companies in the same SIC code, multi-year historical views beyond the current quarterly window, screening filters over the normalized metric set, and export for analysis reports.